As one of NetSuite’s preferred contact center software solutions, Contivio works hard to provide you with all the tools and reporting supervisors you need to lead your organization – even when some, if not all, of your agents are working remotely. Contivio has endless historical reporting capabilities so you can track metrics on a daily, monthly, quarterly, or yearly basis so you can see your team’s trends and opportunities for improvement.
 As a leading contact center software solution, Contivio offers several layers of reporting that can be previewed, exported, or emailed from within your Administrative Portal. These reports can be pulled from the past two years to date, and they provide stats from your entire contact center all the way down to the agent level.
In this blog, we’ll break down some of the most common reports administrators pull to analyze their team’s work. As the contact center software solution of choice, we aim to give you actionable data to make better decisions and maximize your output, all while improving your customer’s experience. Here are some examples of the kinds of historical reports you can pull within the Contivio environment:
Call Center Reporting
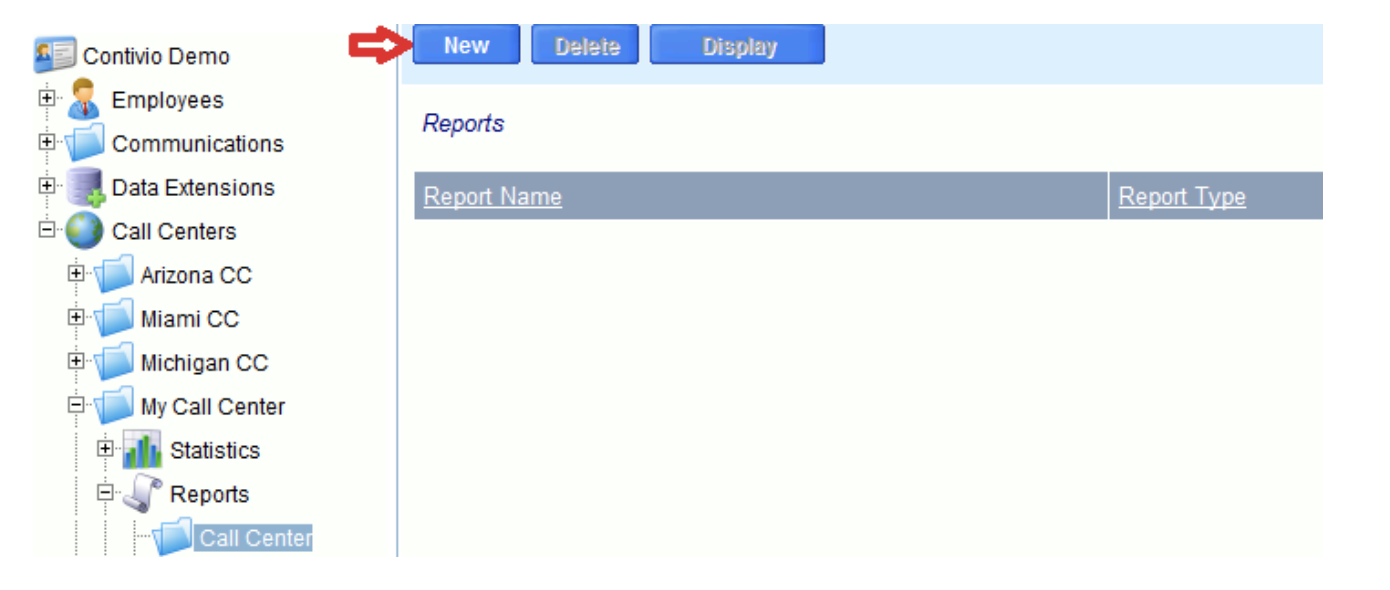
Use Contivio’s historical reporting to get a high-level understanding of your contact center activity. With Call Center reports, you can pull metrics such as daily call volumes, total inbound vs. outbound calls, and overall IVR abandonment rates. To use the Call Center Report, locate your contact center and click on Reports > Call Center. Once you’re there, you’ll click on “New” to create a new report.
Then fill out all the necessary information for the report. When you’re done creating your report, click “Save” and then return to the main menu. If you click on the report’s hyperlink, it will allow you to edit it. If you’d like to view the report, click in the row next to the name and you’ll be able to display the report within the Administrative Portal, or export it to a CSV file. You can also have this report automatically emailed to you and other leaders on your team at the frequency of your choice – to do so, check out our tips blog.
Queue Reporting
Queue reporting is more granular than contact center reporting and has valuable metrics such as service level agreements, queue timeouts, wrap-up times, and handling time on a per-queue basis. Run this report if you want to understand:
- Why your customers are calling (e.g., Are they calling to speak to Sales or place new orders? Or are they mostly calling in for customer care reasons?)
- How much time your agents are spending on customer requests per queue (e.g., How does my handling time in the Sales queue compare to Technical Support or Accounts Receivable?)
- Average time spent in each queue, along with queue abandonment. (e.g., Do certain queues have longer waiting times than others, and is your abandonment rate higher because of it?)
To see a queue report, locate your Contact Center and click on Reports > Queues. From there, create a new report, filling out all of the fields.
Campaign Reporting
Campaign reporting is similar to queue reporting, where you can view more granular stats for each individual campaign your team is running. Campaigns could be anything from outbound preview dialer campaigns to post-call survey campaigns. Use this report if you want to understand:
- Which campaigns or times of day are yielding the highest connection rates.
- How many outbound dialer calls are being placed on a daily, weekly, monthly, yearly basis.
- How many invalid numbers your team dialed. If there is a high volume of invalid numbers, perhaps the list you are dialing is outdated.
To see a campaign report, locate your Contact Center and click on Reports > Campaigns. From there, create a new report, filling out all of the fields. Keep in mind that Campaign metrics are available only for voice.
Agent Reporting
As a supervisor, it’s important to know how each individual agent is performing. Are all of the calls being evenly distributed to each agent? Are certain agents declining more calls than accepting? Do you have an agent who’s taking longer breaks than the rest of the team?
This report will show you the stats for each person on your team. To use this report, go to Call Center > Reports > Agents. From there you can create a new report following the steps below. Keep in mind that you can also view an “Agent Utilization” report to view all agent data across all channels, as well as logged-in times, breaks, and daily activities.
Agent Utilization
The Agent Utilization report is useful for supervisors who want to keep track of their agents’ logged-in time, breaks, availability, and more. You can look at things such as what they’ve been working on, their status history throughout the period, availability metrics, and more.
Contivio – a highly rated contact center software solution – has developed this report to give you more insight into your overall team’s metrics and how you can drive efficiencies.
Disposition Reports
Disposition reports give supervisors additional insight into reasons for customer calls, whether it’s to place a new order, report a product issue, or ask for a return. The disposition report will let you know how many times each agent used each disposition type across all queues and campaigns.
To use this report, go to Call Center > Reports > Dispositions. From there, you can create a new report.
Script Reports
Script reports are beneficial for tracking how often your call scripts are being used, and what the most common questions and answers are. This report will also track which agents are utilizing the scripts you’ve made available to them, and which aren’t using them at all.
To use this report, go to Call Center > Reports > Scripts. From there, you can create a new report.
As the leading contact center software for NetSuite, we know just how important historical data is to company leaders. Having good data can be the key to being able to make educated, real-time decisions that will drive your efficiency and ensure customer satisfaction. If you need help using the many historical reporting features Contivio has to offer, please don’t hesitate to reach out to us at sales@contivio.com.
If you’re looking for a contact center software solution that offers in-depth reporting tools, look no further than Contivio. We’re here to be your partner in extending the functionality of your CRM and giving you the tools your team needs to be successful. To learn more about the many features Contivio offers, click here, or set up a free demo here.