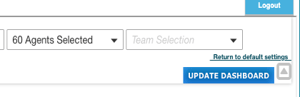
As your sales, customer service, and support teams are working from home, it’s more important than ever to have detailed insight into the efficiency of your call center. With that in mind, we’re pleased to release our next-generation dashboard for supervisors and agents. Simply select the “UPGRADE DASHBOARD” icon at the top right of your screen (when you login to the dashboard) and within seconds the update will take effect.
As we always have from an R&D standpoint, we’ve collected countless feedback from existing customers to help shape this dashboard upgrade. Our goal is to optimize the experience for both agents and supervisors, and we’re confident this release does just that. Just keep in mind all of your existing filters (e.g., selected agents, queues, timeframes) will remain active within the new dashboard. In terms of access we recommend you run the dashboard in Google Chrome. If needed, simply copy and paste the URL into Chrome and launch immediately.
Some of the main highlights in this release include
-
- Improved flexibility to move, expand, & shrink various charts.
- Color alerts to highlight when breaks exceed appropriate durations.
- Option to expand bar/pie charts to full screen.
- Run aggregate GoS metrics across multiple queues by channel.
For those of you unfamiliar with our dashboard approach we provide a real-time snapshot into your call center stats - dating back 7 days. For historical metrics greater than 7 days Contivio’s enterprise historical reports cover this off in detail. As a quick refresher we have listed below some of the key go-to-charts from our dashboards.
- Agent status and utilization
- Real-Time Agent Status – This report shows you what your agents are working on and what their status is in real time.
- Agent Statistics – This table shows a breakout of each agent and their overall stats for the time frame you’ve selected (up to 7 days).
- Agent Availability – This report allows you to visually see how much time your agents have spent logged in, ready, busy, on break, or handling each media type. You can view this report per agent and filter results from the last hour, day, or 7 days to identify any trends in behavior and ensure that your agents are online all day.
- Call volume by date, queue, campaign, and agent
- Call Volume by Date – This bar graph visually shows the breakout of your calls per day (up to the last 7 days).
- Call Volume by Queue (or Campaign) - This bar graph shows your queues’ call volume broken out by successful call type (inbound, outbound, and campaign). This report is a great way to see the top reasons your customers are calling in.
- Call Volume by Agent – This bar graph shows your agents’ successful call volume broken out by call type (inbound, outbound, and campaign).
- Call Distribution by Agent - This simple pie chart gives you a quick visual of how your successful calls are being distributed by the agent.
- Calls in Progress – In this table, you will be able to see a real-time snapshot of all the calls currently in progress in your call center, including the ones waiting in the IVR or any of your queues.
- Inbound statistics by queue and channel
- Call Distribution by Queue / Campaign – This simple pie chart shows you a call distribution by queue or campaign.
- Inbound Queue Statistics – Using this table, you’re able to see your inbound statistics per queue and media channel.
- Queue Gauges – The Queue Gauges report is meant to give you a high-level overview of all the activity in your contact center.
- Dispositions by agent, queue, and campaign
-
-
- Disposition by Queue / Campaign – If you’re using dispositions in your contact center, this bar graph shows you the # of dispositions that were saved per queue or campaign. This is helpful to visualize the reasons many of your customers call in, and what the typical result is per call.
- Disposition by Agent – This chart displays the total number of dispositions selected by each agent. This is helpful to visualize any trends in your agents’ performance.
-
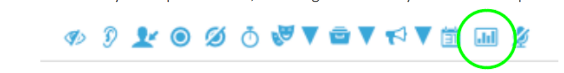
For any first time users the dashboard can be accessed directly from the Contivio toolbar or floating app by clicking on the Reports icon. Contact center supervisors, admins, and team supervisors will be able to see results for the team members they’re responsible for, while agents will only see their own personal data.
If you’re not using the Contivio app, the dashboard can also be reached by opening up your
Administrative Portal and clicking on Call Centers > Contact Center > Statistics > View Dashboard.
Once you’re in the dashboard, you can also filter your data in six different ways using the drop-down menus at the top of the screen:
- Contact Center – Used if you have multiple contact centers
- Charts you’d like to view – By default, we will show all of them at once, but you always have the option to remove any charts that aren’t relevant for your contact center
- Time Frame – Last hour, 2 hours, 4 hours, 24 hours, today, yesterday, last 7 days
- Queue – You can view 1 queue, all queues, or a selection
- Agent – You can view 1 agent, all agents, or a selection
- Team – For larger contact centers, you can view specific teams or groups of agents
After you’ve selected the metrics and time frame you want to review, your data will appear in a variety of bar charts, pie charts, scatter charts, and tables so you can easily identify any trends or outliers. You can reorganize and resize the charts by clicking and dragging the arrow button in the bottom right corner of each chart unit. Each unit can be stretched to fill an entire screen, allowing you to prominently display it on your computer or a large screen in your contact center.
Contivio is a powerful enterprise phone system that gives supervisors the tools and data you need, when you need it most – right in the moment. Our real-time dashboard is one of the most useful tools for leadership teams for this very reason. You can see how your agents are performing and ensure that your customers are being taken care of every time.
For additional questions, refresher training or assistance with your new dashboard please feel free to reach out to us at sales@contivio.com.
If you are not yet a Contivio customer and would you’d like to learn more about Contivio’s enterprise cloud contact center, sign up for a free demo today!