Using this table, you are able to see your inbound statistics per queue and media channel.
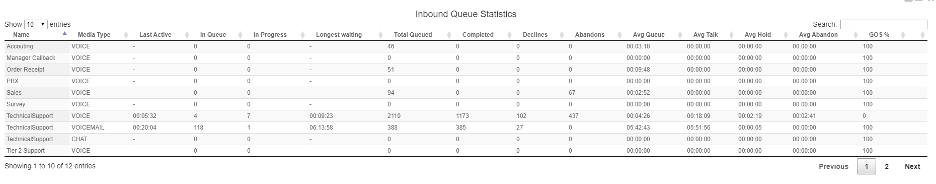
- Name: the name of your queue
- Media Type: queue channel (Voice, Chat, Email, Voicemail, SMS, Fax)
- Time since last completed call: amount of time passed since the last call or media interaction took place.
- In Queue: total number of calls or media waiting in the queue.
- In Progress: total number of calls or media being handled.
- Longest Call Waiting: the longest amount of time a call or piece of media has been waiting in the queue (prior to being handled by an agent)
- Total Queued: total amount of calls that were queued.
- Completed: total amount of calls that were successfully answered by an agent and completed
- Declines: total amount of calls or media that were declined or ignored by an agent
- Average Queue Time: average amount of time spent waiting in queue.
- Average Talk Time: average amount of time agents spent speaking to customers or handling media.
- Average Hold Time: average amount of time agents put contacts on hold.
- Average Abandon Time: average amount of time contacts wait in queue before abandoning the queue.
- Grade of Service (GOS) Percentage (%): percentage of calls that are answered within the configured GOS threshold. The time interval over which GOS is calculated is according the configured GOS Time for the queue. (E.g., if GOS Threshold is set to 60 and GOS Time is set to ‘Today’, the GOS Percentage figure will contain the percentage of calls to the queue that were answered within 60 seconds today)
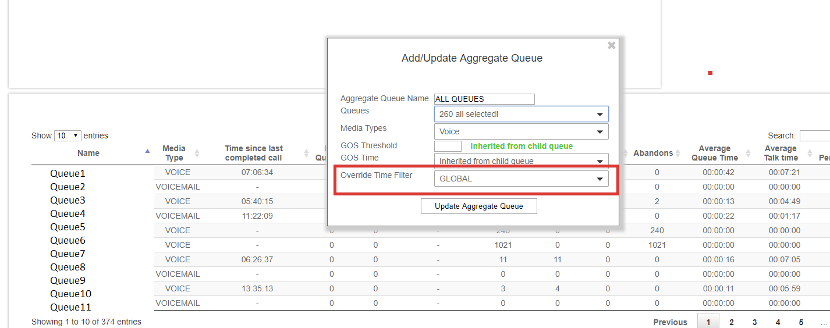
Aggregate Queues - This feature enables user to create virtual aggregate queues for the purposes of reporting. Aggregate Queue allow for selection of multiple queues with metrics aggregated for a single virtual queue. Aggregate queues are available to be graphed within Queue Gauges and Queue Progress charts. The aggregate queue is configured with the following:
- Aggregate Queue Name: name of the aggregate queue
- Queues: selection of Queues that are to be considered for aggregate calculation
- Media Types: media type of the aggregate queue
- GOS threshold: time in seconds for which all calls considered in aggregate queue must be answered within to pass the GOS percentage calculation. If this value is left empty the aggregate queue will consider the GOS threshold of the queue for which the call came on. This allows for GOS threshold consideration with aggregation while considering individual queue GOS expectations. For example, an aggregate queue contains a Sales queue with a GOS threshold of 30 seconds and a Support Queue with a GOS threshold of 60 seconds. An aggregate queue set to inherit GOS threshold would result in a GOS calculation where Sales calls are considered against the Sales GOS threshold and Support calls against the Support GOS threshold (i.e., a sales call answered under 30 seconds or a support call answered under 60 seconds would be attributed as a call meeting the GOS for the aggregate queue.
- GOS Time: interval over which GOS for the aggregate queue is calculated. If set to “Inherited from child queue”, the time interval is considered from the specific queue for the call being considered. (In much the same way as GOS threshold is inherited)
- Override Time Filter: allows for calculation of all queue metrics over a different time period than that of the Global filter at top of the dashboard. This allows for aggregate queue metric calculation over differing time periods. For example, this allows for creation of aggregate queues comparing performance of today VS yesterday.
This allows for aggregate queue calculation and comparison across time periods as below:
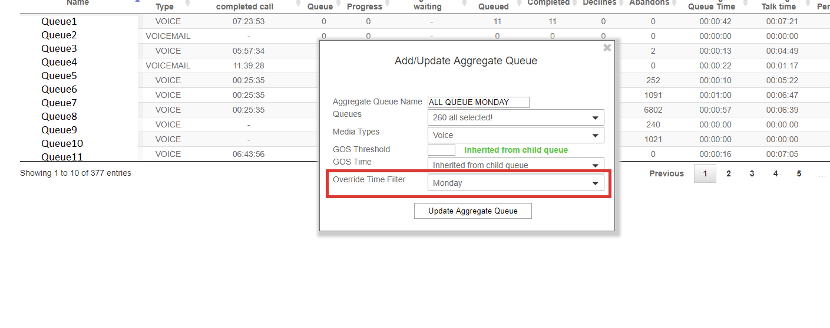
In diagram below, the performance of all queues across Monday VS Tuesday VS 7 days (based on Global filter) can be compared:
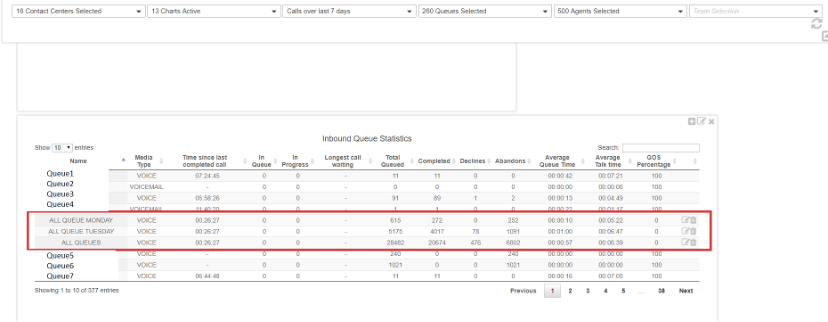
Tip: It's possible for the combined number of declined calls and completed calls to exceed the total queued calls on this chart. This is due to the same call being declined more than once.
Next: Call Distribution By Queue/Campaign