This simple pie chart shows you a call/media distribution by queue or campaign. Simply roll your mouse over each queue or campaign to see the percentage of calls that were handled by each queue or called by each campaign.
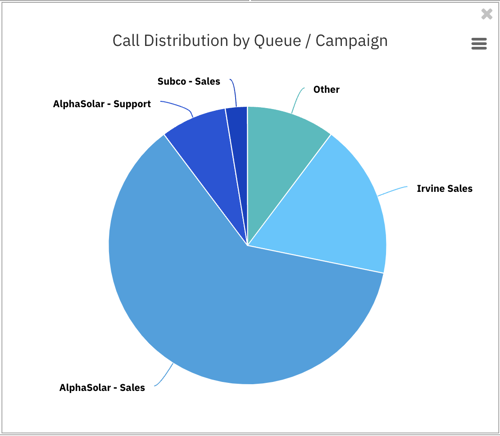
This simple pie chart shows you a call/media distribution by queue or campaign. Simply roll your mouse over each queue or campaign to see the percentage of calls that were handled by each queue or called by each campaign.