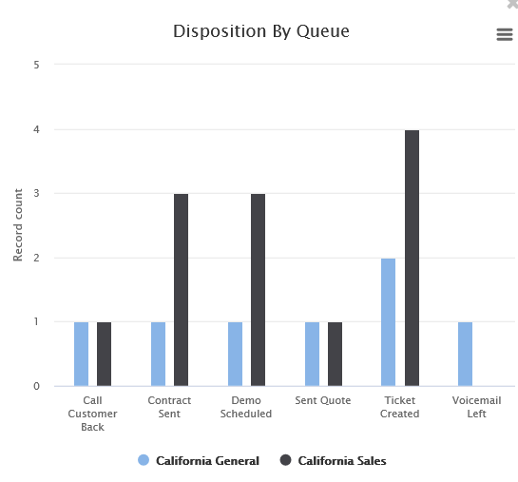
If you are using dispositions in your contact center, this bar graph shows you the number of dispositions that were saved per queue or campaign. This is helpful to visualize the reasons many of your customers call in, and what the typical result is per call.