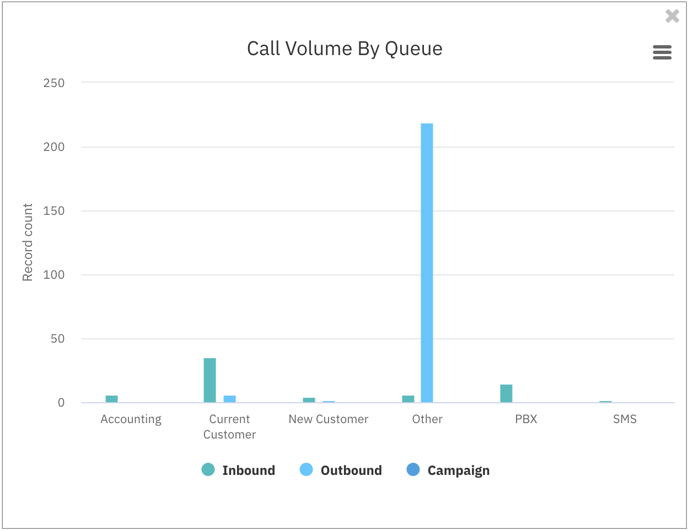
This bar graph shows your queue volume broken out by successful call type (inbound, outbound, and campaign). This report is a great way to see the top reasons your customers are contacting you for. Are they calling mostly to speak to Sales, Support, or Finance? Which campaigns are being used the most?