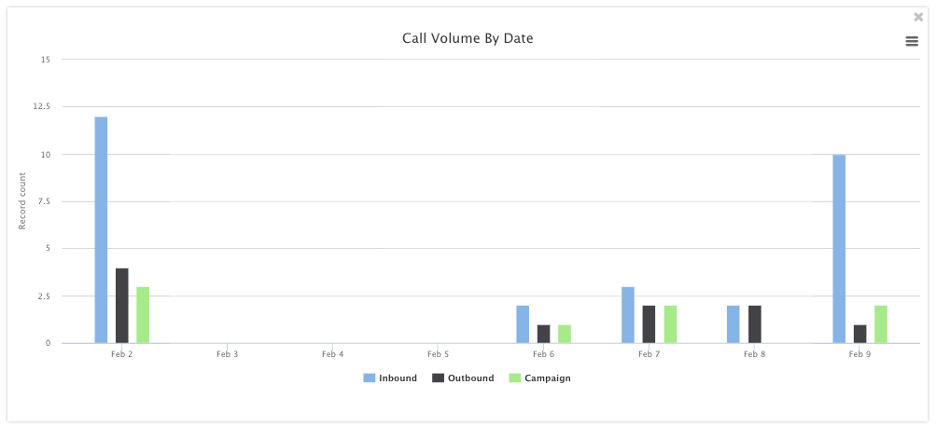
This bar graph visually shows the breakout of your calls & media per day (up to the last 7 days). The blue bars represent the total # of successful inbound calls (into your contact center or to your agents), the black bar represents the total # of successful outbound calls (from your contact center or agents) and the green bars represent calls made from campaigns. Campaigns can include post-call surveys, broadcast campaigns or preview / predictive dialing campaigns. Note that these charts do not include IVR or Queue Abandons.