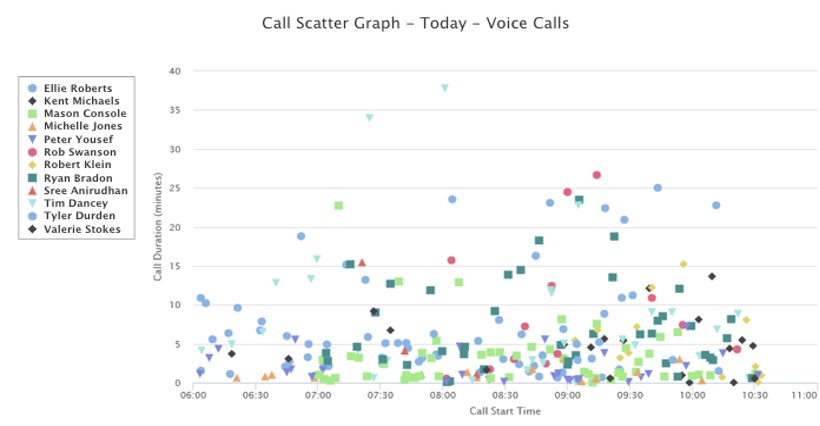
This graph visualizes all the Voice calls that took place by agent, duration, and hour. Here you will be able to see the average amount of time your agents spent speaking to customers and identify any outliers. You will also be able to visualize what the volume and duration was like per hour, and potentially identify any “peak hours” for your queue or call center.