Use Contivio’s "Contacts" Reports to get a high-level understanding of your Contact Center activity. With Contact reports, you can pull metrics such as daily call volumes, total inbound vs. outbound calls, and overall IVR abandonment rates.
"Contacts" Reports also provide valuable metrics such as service level agreements, queue time-outs, wrap-up times and handling time on a per-queue basis. Run these types of reports to collect date on:
- Why your customers are calling (e.g., are they calling to speak to Sales or place new orders? Or are they mostly calling in for customer care reasons?)
- How much time your agents are spending on customer requests per queue (e.g., how does my handling time in the Sales queue compare to Technical Support or Accounts Receivable?)
- Average time spent in each queue, along with queue abandonment. Do certain queues have longer waiting times than others and is your abandonment rate higher because of it?
With a variety of different filter options, "Contacts" Reports will be your go-to for a variety of different scenarios.
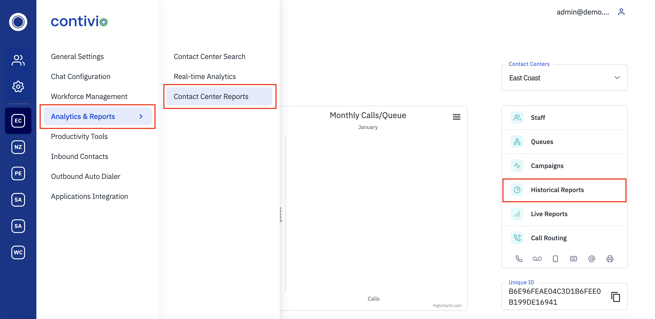
- To create a "Contacts" Report navigate to "Call Center" > "Analytics & Reports" > "Contact Center Reports", OR select "Historical Reports" from the main admin portal screen.
- Click
 and complete the necessary fields:
- Report Name - Use a descriptive name indicating the data and timeframe so you can always refer back to it for future reference.
- Report Type - Select "Contacts".
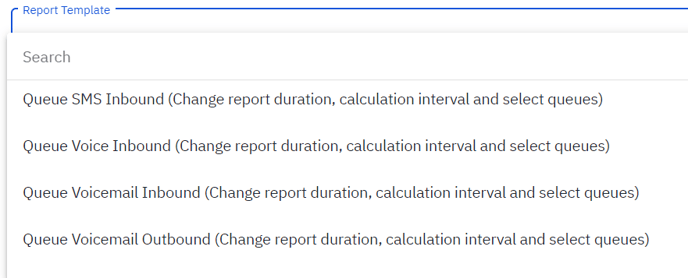
- Report Template - Select from the list provided, which will pre-populate the duration, calculation, statistics, filters, and grouping, or select "Other" to build your own.
Various templates are available, including:- Queue Voice Inbound
- Agent Voice Inbound
- Call Center Voice Inbound
- Report Duration - Choose the date range you want to see results for (e.g., Hourly, Daily, Weekly, Monthly, Yearly, User Defined).
- Calculation Period - Select the Interval of Time (e.g., 15 min, 1 Hour, 1 Day, 1 Week, 1 Month) - This is how your reporting will be broken out.
- Time Format - Select your preferred Time Format (HH:MM:SS vs. Seconds)
- Statistics - Check off the metrics you would like to report on. A detailed breakdown of metrics is included in the table below. If using a queue template, these will be auto-populated, but you are free to add/remove statistics.
- Select "Filter" for further customization to zero reporting data down to the granular level.
- Initial Handling Only - If selected, only the first leg of the call will be counted in the report. Any transfers or conference calls will be excluded.
- Exclude Internal Calls - Calls between agents will be omitted from the report
- Exclude Weekends - Calls on Saturday and Sunday will not be counted in the report
- Media Type - Select the channels you wish to include in this report (e.g., voice, SMS).
- Direction - Select inbound or outbound.
- Queues & Campaigns - Include only certain Queues/Campaigns in this report.
- Agents - Include only certain Agents in this report.
- Team - Run this report at the team level. This requires teams to be enabled under Workforce Management.
- Dispositions - Run this report to only include specific dispositions.
- Contact Result - Run this report for only interactions that meet specific criteria (e.g., Queue Abandoned, Declines).
- Select "View" to define how the report should display.
-
- Group By - Will define how the report should break down into individual buckets. If you select "Agent" for example this report will provide a summary of the date configured split by agent. If you select "Queue" for example each queue will have its own bucket within the report.
- Row - We recommend you leave this on "Statistics".
- Column - This will determine if the "Column" for each "Statistics" is broken down at the queue, user, or disposition level.
-
- Hit "Done"
 and your report will display under "Contact Center Reports".
- From this view you can edit reports, export to excel, or view in Contivio.
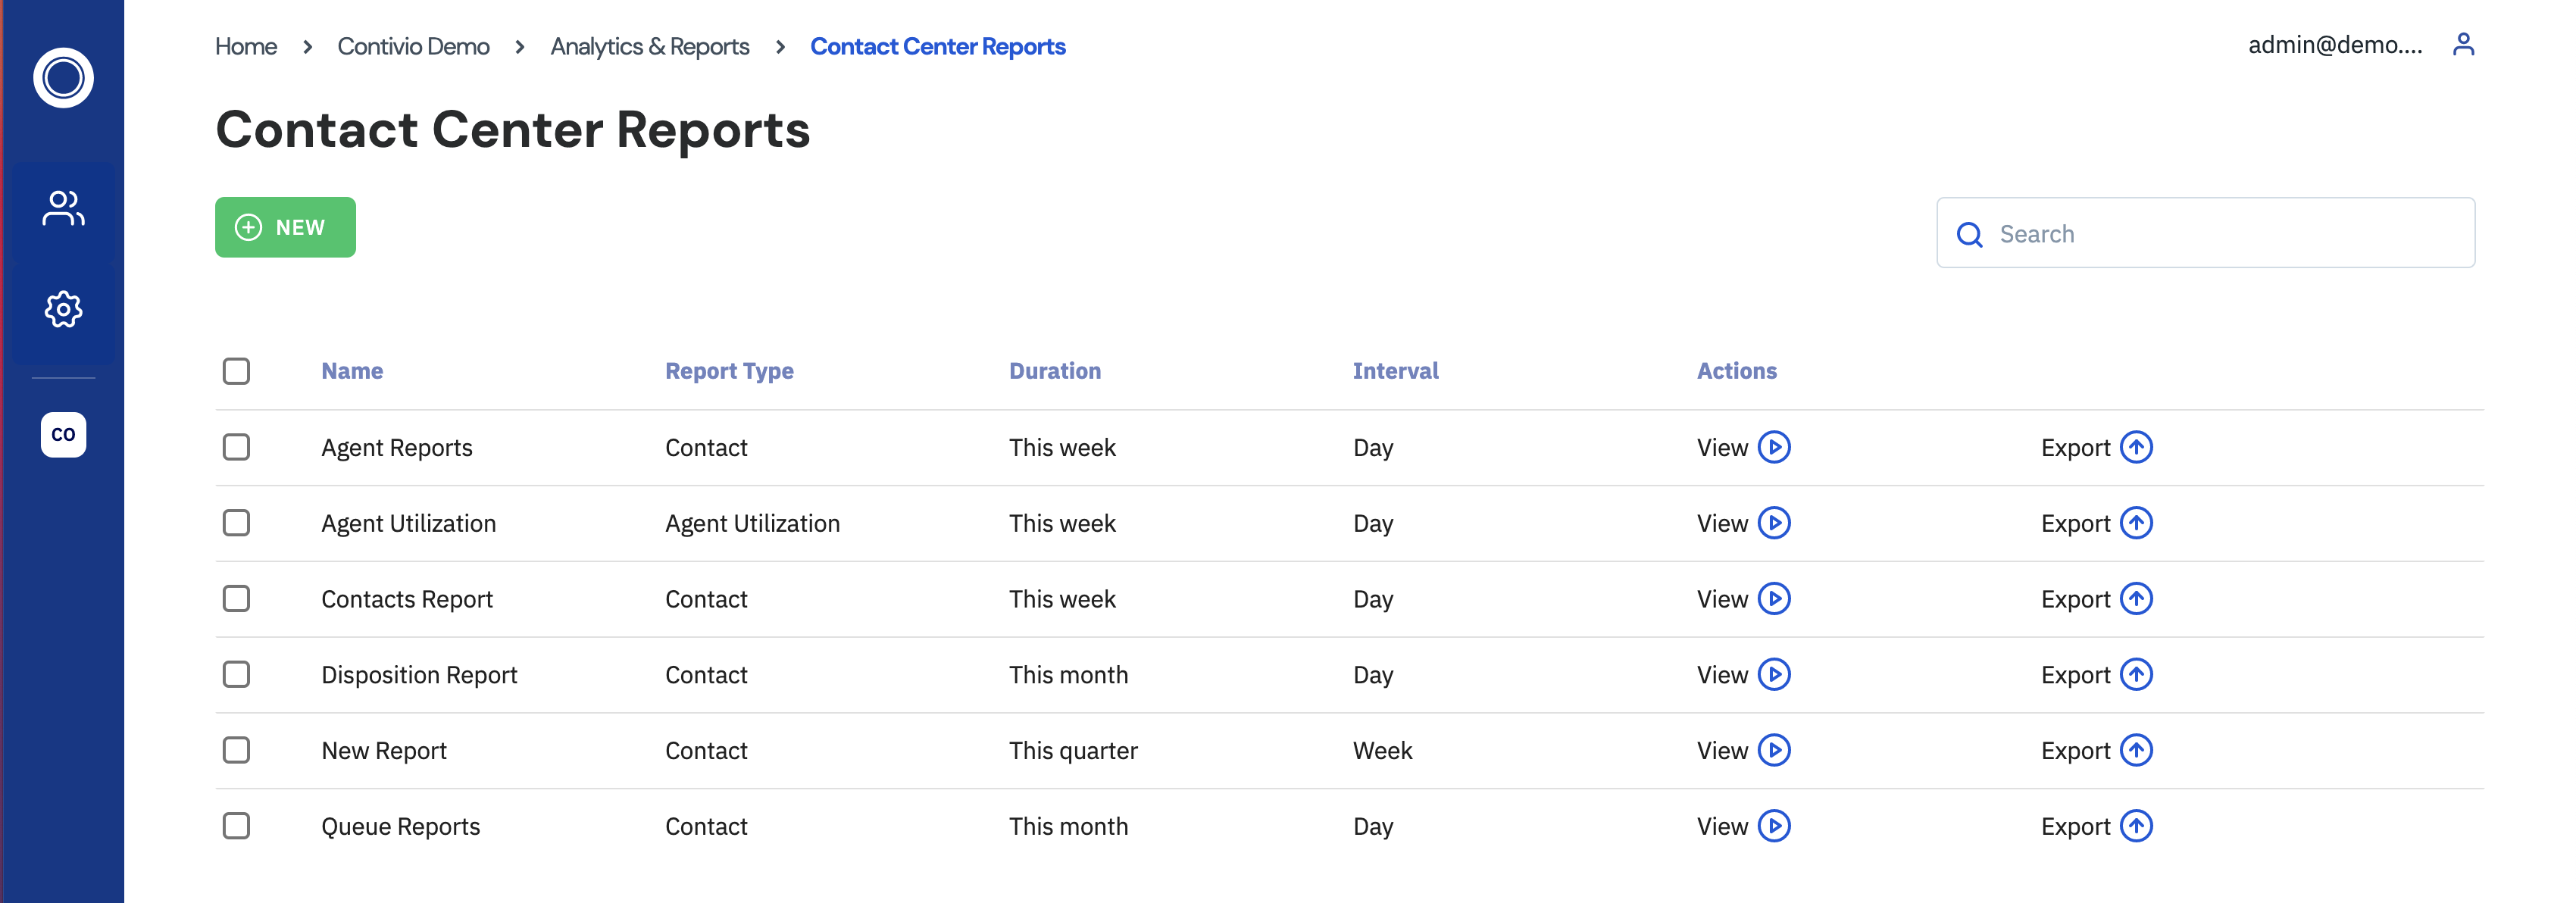
Tip: If the results of a report are blank make sure you do not have duplicate filters (e.g., Row by Agent, Column by Agent).
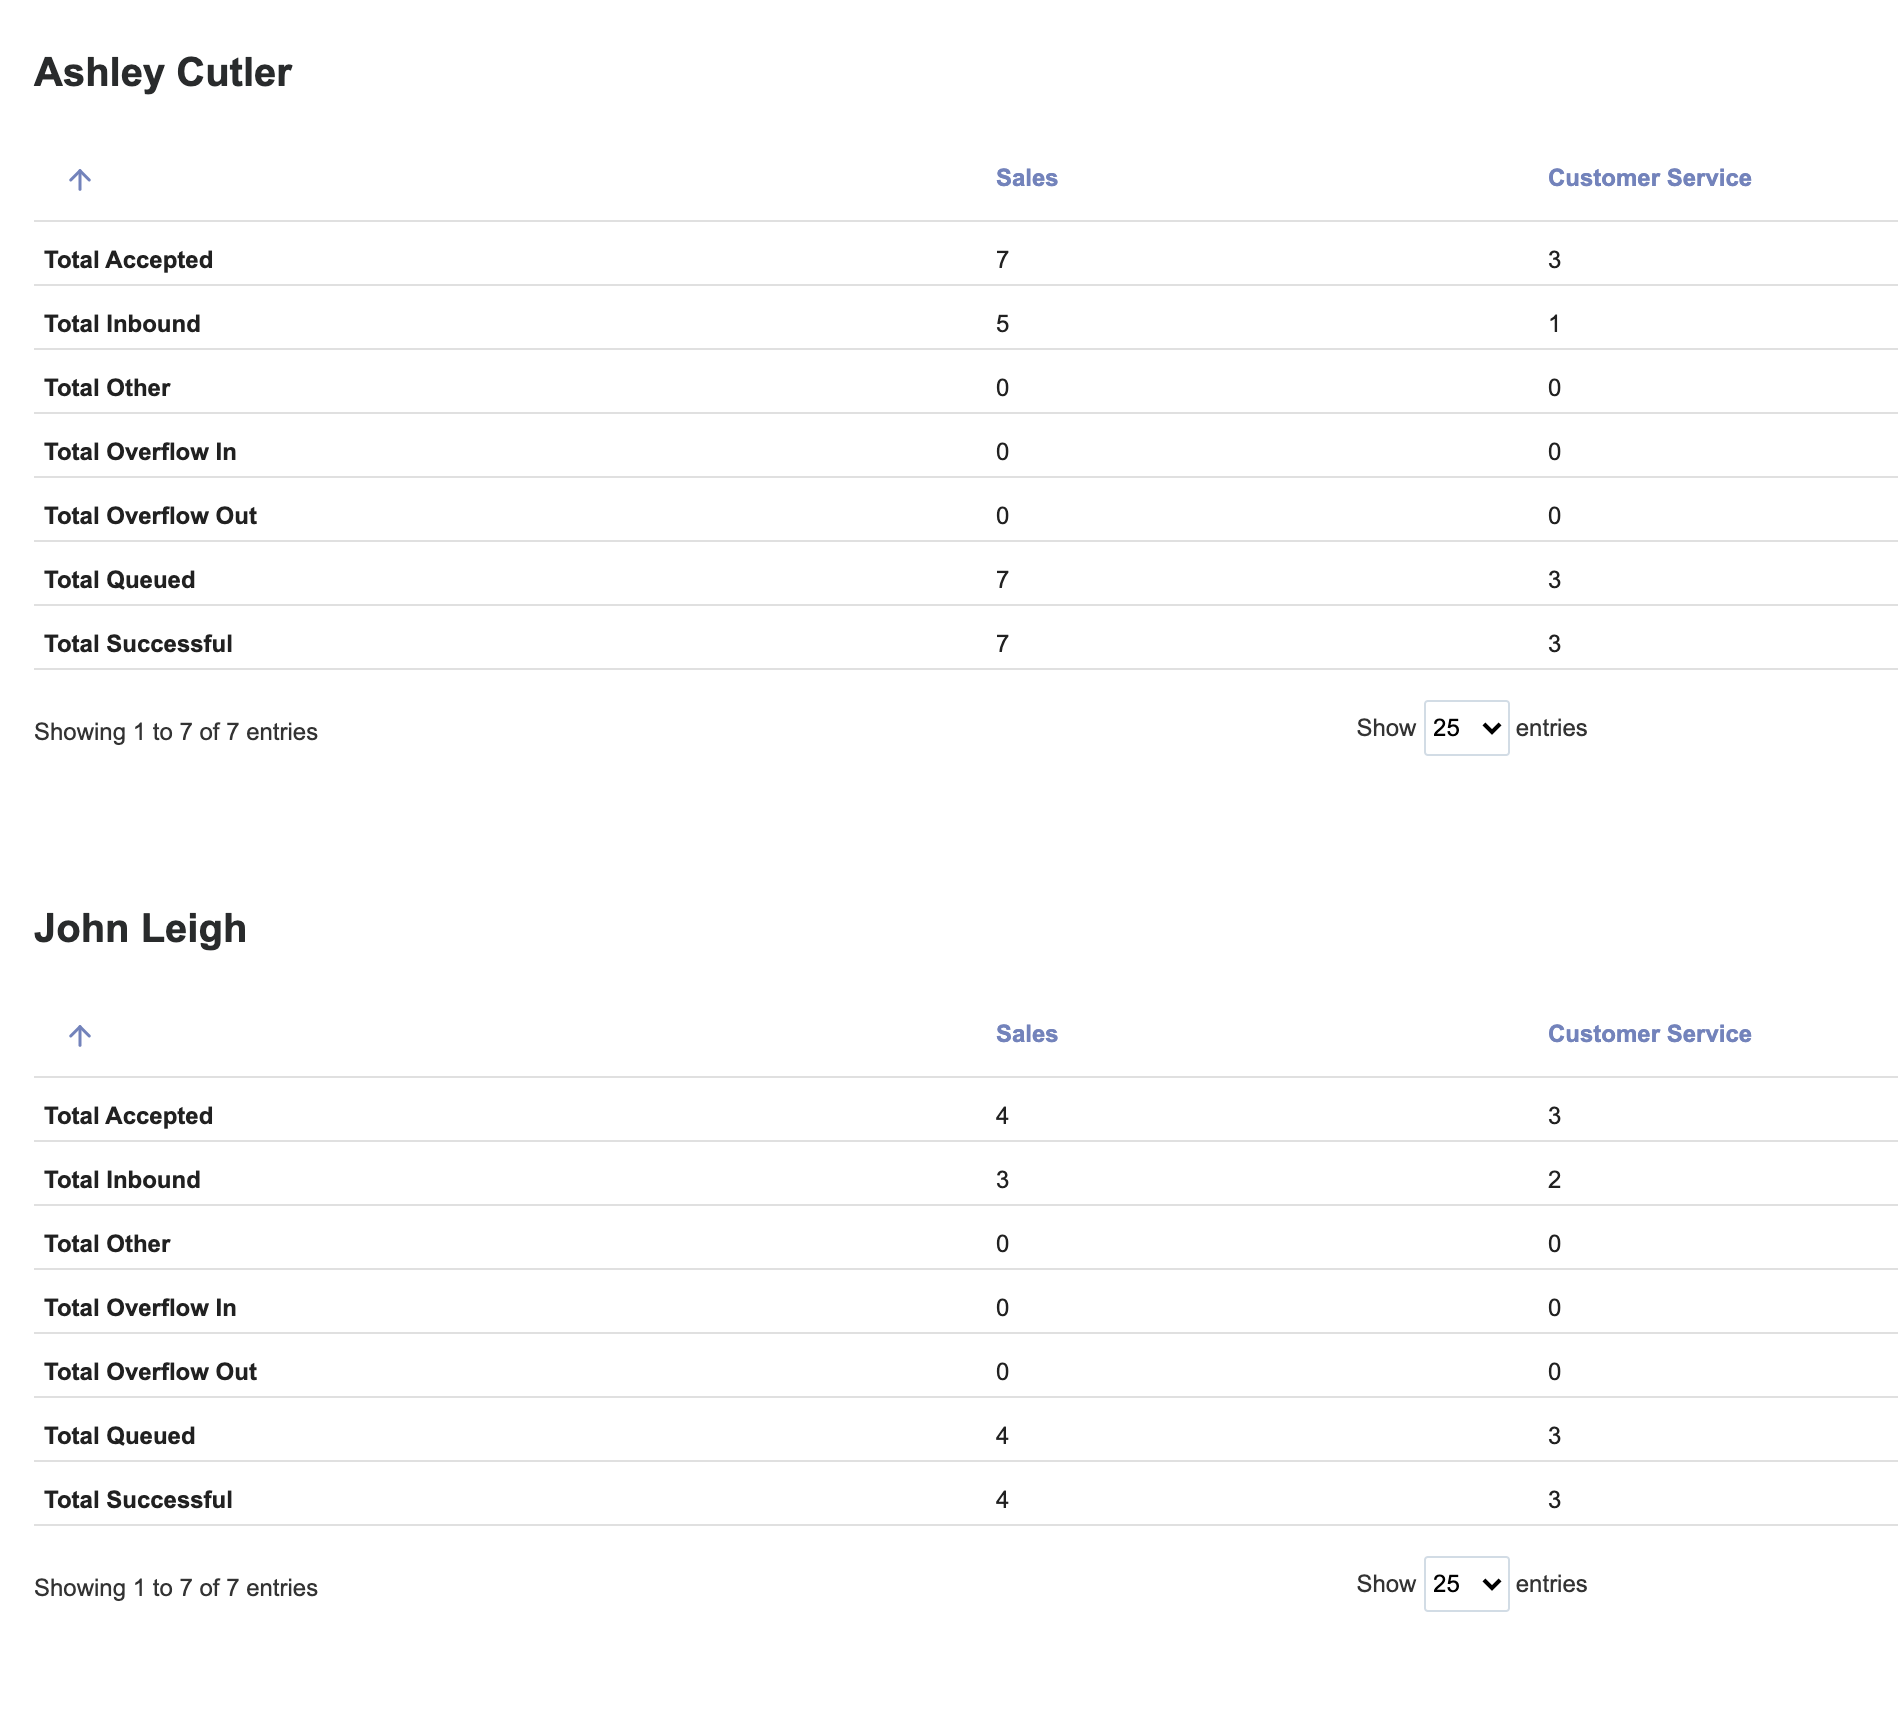
The below report is an example of seven (7) core metrics broken down for the day across two queues (i.e., Sales, Customer Service). The "Group By" is done at the "Agent" level, hence why you see two users displayed.
|
Abandoned by auto dialler |
Total number of calls abandoned by auto dialer |
|
Abandoned by auto dialler percentage |
Percentage of calls abandoned by auto dialer |
|
Abandoned in IVR |
Total number of calls that hung up while in the IVR menu |
|
Abandoned in IVR percentage |
Percentage of calls that hung up while in the IVR menu |
|
Abandoned in queue |
Total number of calls hung up by the caller while waiting in the queue |
|
Abandoned in queue percentage |
Percentage of calls hung up by the caller while waiting in the queue |
| Average agent answering time | Time the agent takes to answer a call upon initial ring. |
| Average call handling time | Composed of talk time, hold time, and time taken for agent to answer |
| Average call time | Length of average call. Includes hold time, transfers, and talk time. |
| Average calls hold time | Average time a call spent on hold |
| Average Exclusive Handling time | Average handling time for calls only handled by a specific agent. |
| Average Exclusive Hold time | Average hold time for calls only handled by a specific agent. |
| Average Exclusive Talk time | Average talk time for calls only handled by a specific agent. |
| Average queue time | Average time a call spent waiting in the queue |
| Average speed of answer | Average time a call was answered |
| Average talk time | Average talk time for calls. |
| Average time to abandon call | Average time of callers hanging up before connecting to an agent, including in the IVR and in queues. |
| Average time to abandon call in IVR | Average time of callers hanging up within the IVR. |
| Average wrap up time | Average time that a call spent in wrap-up |
| Busy | Time spent in busy state. |
| Busy percentage | Percentage of time spent in busy state. |
| Call backs answered | Total number of call backs answered |
|
Call backs percentage |
Percentage of calls that were callbacks |
|
Call backs requested |
Total number of call backs requested by customers |
|
Call backs requested percentage |
Percentage of call backs requested |
| Calls abandoned | Total number of abandoned calls. Includes calls abandoned at the IVR and queue levels. |
| Calls abandoned by agent | Total outbound calls abandoned by the agent -- agent hung up before connecting. |
| Calls abandoned by agent percentage | Percentage of outbound calls abandoned by an agent. |
| Calls abandoned percentage | Percentage of calls that were abandoned |
| Calls answered by agent | Total number of calls that were answered by the agent |
| Calls handling time | Aggregate time of call handling (talk, hold, time to answer) |
| Calls hold time | Total time spent on hold |
| Calls overflowing into queue | Number of calls that were redirected into queues due to overflow settings |
| Calls overflowing out of queue | Number of calls that were redirected out of queues due to overflow settings |
| Campaign calls | Total number of campaign calls |
| Campaign calls percentage | Percentage of total calls that were campaign calls |
| Cancelled calls | For inbound calls these are calls that were ended while en route to an agent. For outbound calls these are calls cancelled by an agent. |
| Cancelled calls percentage | Percentage of calls that were cancelled |
| Chats timed out and emailed percentage | Percentage of chats that timed out while waiting in queue |
| Chats timed out and emailed | Number of chats that timed out while waiting in queue |
| Dialled number is invalid | Number of calls that reached an invalid number |
| Dialled number is invalid percentage | Percentage of calls that reached an invalid number |
| Diverted to voicemail | Number of calls diverted to voicemail |
| Diverted to voicemail percentage | Percentage of calls diverted to voicemail |
| Exclusive Handling time | The total time agents spent handling call records matching the report filter criteria exclusively . For Voice calls, this equates to Talk time + In call hold time + Wrapup time. |
| Exclusive Hold time | The total hold time of how long callers spent on hold for calls matching the report filter criteria exclusively |
| Exclusive Talk time | The total talk time of how long calls were in a talking state for calls matching the report filter criteria exclusively |
| Failed calls | Number of failed calls |
| Failed calls percentage | Percentage of failed calls |
| Grade of Service percentage | Percentage of calls that exceeded the GOS |
| Hold time percentage | Percentage of time calls spent on hold |
| Inbound calls | Total number of inbound calls |
| Inbound calls declined | Total number of times that a call was declined by an agent |
| Inbound calls declined percentage | Percentage of call offers that were declined |
| Inbound calls percentage | Percentage of calls that were inbound |
| Maximum queue time | Longest amount of time a caller waited in the queue |
| Other calls |
"Other Calls" refers to any calls not associated with a queue. These can include:
|
| Other calls percentage | Percentage of calls not classified with a result of interest |
| Outbound calls cancelled | Total number of outbound calls that were cancelled (hung up by customer or agent) while call was ringing. |
| Outbound calls cancelled percentage | Percentage of outbound calls that were cancelled (hung up by customer or agent) while call was ringing. |
| Outbound calls made | Total number of outbound calls |
| Outbound calls percentage | Percentage of calls that were outbound |
| Queued calls | Total number of queued calls |
| Successful calls | All calls that were completed successfully |
| Successful calls percentage | Percentage of calls completed successfully |
| Talk time | Total time talking to callers |
| Timed out in queue | Number of calls that hit the maximum wait time in queue |
| Timed out in queue percentage | Percentage of calls that hit the maximum wait time in queue |
| Wrap up time | Total amount of time spent in wrap up |
Tip: Contivio recommends using templates to ease the process of creating reports. Each template will auto-populate unique filters to allow administrators to create a new report in seconds. Additionally, statistics from the list above specially tailored to each report template will be automatically applied.
Next: Agent Utilization Report